Contact email: humstats@gmail.com
Update, 20th August: sample size increased from 48 to 173 for London, from 98 to 247 for Birmingham, from 37 to 117 for Manchester, from 29 to 32 for Bristol. The ethnic pattern did not experience significant change (see below).
Very short summary:
1. Over 50% rioters are black, below 30% are white;
2. Black people are over 10 times more likely to participate in riots than whites;
3. High unemployment in London -> riots?
4. Black areas -> riots?
5. Low social class != riots, low training !=riots;
6. Black areas = high unemployment;
7. High unemployment + black areas = riots;
8. High unemployment + non-black areas = no riots;
9. Average or low unemployment + black areas (rare) = riots, but fewer
1. CCTV in 2; 2. CCTV, data in 2; 3. map in 1D; 4. map in 1A; 5. maps in 1B, 1C;
6. map in 1E-; 7. maps in 3E; 8. maps in 1E, map in 3B; 9. map in 1E-2
Introduction
The media seem to focus exclusively on the social class of the August rioters, while claiming the absence of a large ethnocultural undercurrent. There is an excessive concentration on 'chavs' or 'yobs', who are understood to be white. However, chavs form but a minority of rioters and looters, while the disproportionate majority is Black African and Afro-Caribbean. This will be illustrated below using authoritative sources, in three arguments.
Methods
1. Distribution of ethnicity and other factors in London. I will show the distribution of riots and addresses of the arrested on the following maps of London: a. Black African and Afro-Caribbean population; b. Education, skills and training; c. Social class; d. Unemployment; e. Combined map of ethnicity and unemployment.
No significant correlation was found on B and C. D and especially A show a stronger correlation. However, that may be because of a large tie between A and D. The best result is with E, which predicts riots with formidable precision.
2. Ethnicity of riot suspects on police CCTV by percentage. I will examine all available photographs on the official police CCTV sources to determine the ethnic make-up of rioters. I will then compare the proportions of ethnicities to the total population.
Photographs show that most (~50%) rioters were black even in areas with a small black population, such as Bristol. There is a vast overrepresentation of Black British among rioters in comparison to their total percentage in a city. Their likelihood of participating in riots in comparison to whites is more than 10 times higher. Ethnicities are marked to ensure verifiability.
3. Black population and chance of riots in London boroughs and large settlements. I will substantiate the preceding arguments with additional data showing: a. London boroughs by black population and riots; b. 20 largest settlements, their black population and riots; c. Unemployment and riots alongside the list of the largest settlements.
This shows that black population is greatly indicative of the chances of riots both in London boroughs and in settlements. The total size of the settlement does seem to influence the chance of riots, as in the case of Nottingham or Glasgow. Albeit in London unemployment was found to have a fairly strong correlation with the riots, that is not the case with the UK. Many non-rioting areas had very high unemployment (parts of Scotland, NE England, S. Wales, N. Ireland, etc.), but all of them had a minor black population.
1. Race over unemployment over education and class
Maps of riots and addresseses of rioters, taken from The Guardian and The Daily Telegraph as of 13th August, are superimposed on maps from LondonProfiler by UCL.
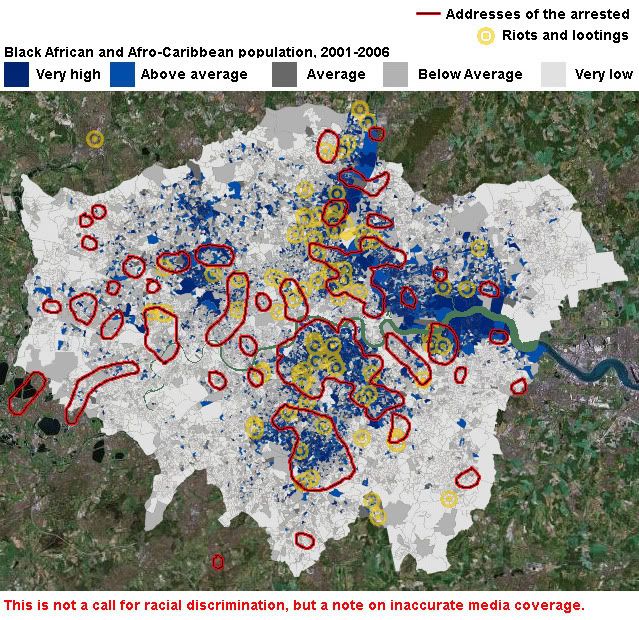
a. Black Africans and Afro-Carribeans. No riots occurred in areas that were far away from large concentrations of black population. Most of the areas with a large black population witnessed the heaviest riots that included multiple arsons.

b. Not the underskilled. The primary characteristic of the underclass, specifically 'chavs', is the absence of education, skills and training. This map shows a clear lack of any correlation between riots and these factors. Large areas in the east and especially the west of London such as Hillingdon are undereducated, but saw no riots. The south central areas are more skilled, but had riots.
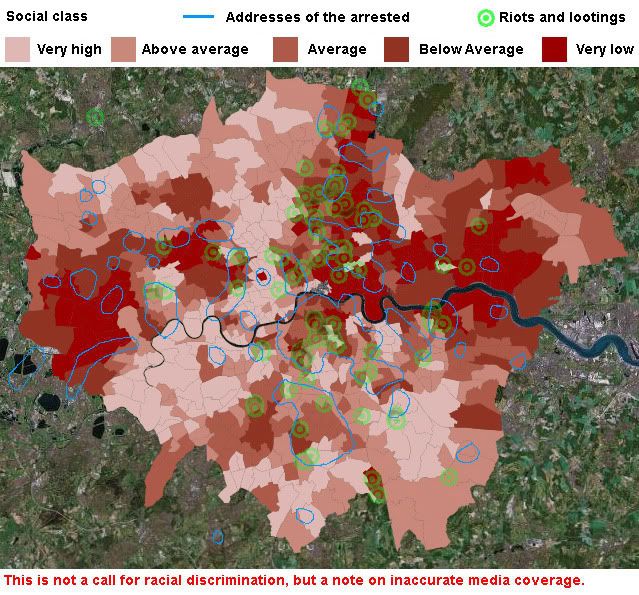
c. Not the lower classes. 'Chavs' are generally associated with the lower class - in fact, some believe the concept itself to be classist. Yet, as with education, there are large lower class areas such as Havering that saw no riots. While there are few riots in the more well-off areas, some of the most devastated large areas, such as Croydon, were not lower class.

d. Unemployed, perhaps. The underclass is inevitably unemployed. The east, north-west and west extremes show reasonable employment, thus excluding the most extravagant outliers in the above cases. The south still does not fit well, however. Unemployment appears to be the best purely socioeconomic correlate of riots.
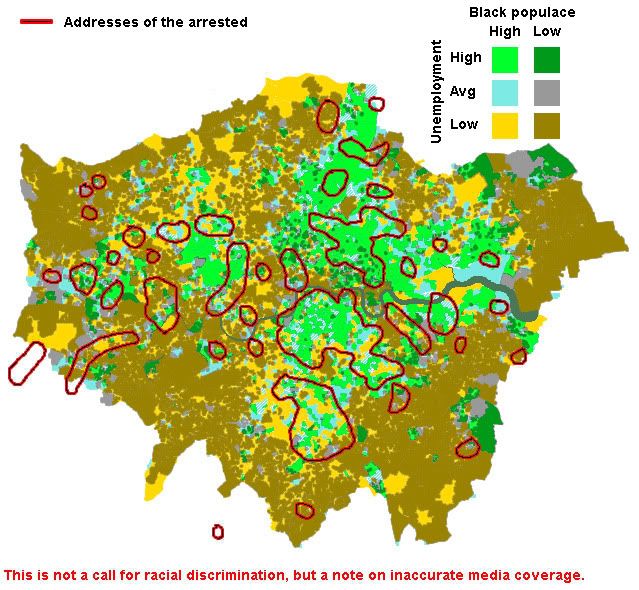
e. Reason: black and unemployed, or just black. Areas with a high black population and high unemployment (light green) dominate all other black areas (cyan and light gold). Almost all riot addresses fall within the vicinity of light green zones. Though black areas with normal employment are a minority, they also are covered by the rioters, if to a smaller degree. White/cyan areas experienced riots.
Most areas with a low black population have lower unemployment. However, it is important to note that isolated dark green areas - non-black, but with high unemployment - have no riots. A particularly vivid example of it is Tower Hamlets, whose poor non-black populace separates two large rioting zones. This map explains the absense of riots in the extreme east and their presence in the south.
It is impossible to predict the riots using the class and the skill maps, and even unemployment is highly imprecise. The ethnic map is the best predictor of riots.
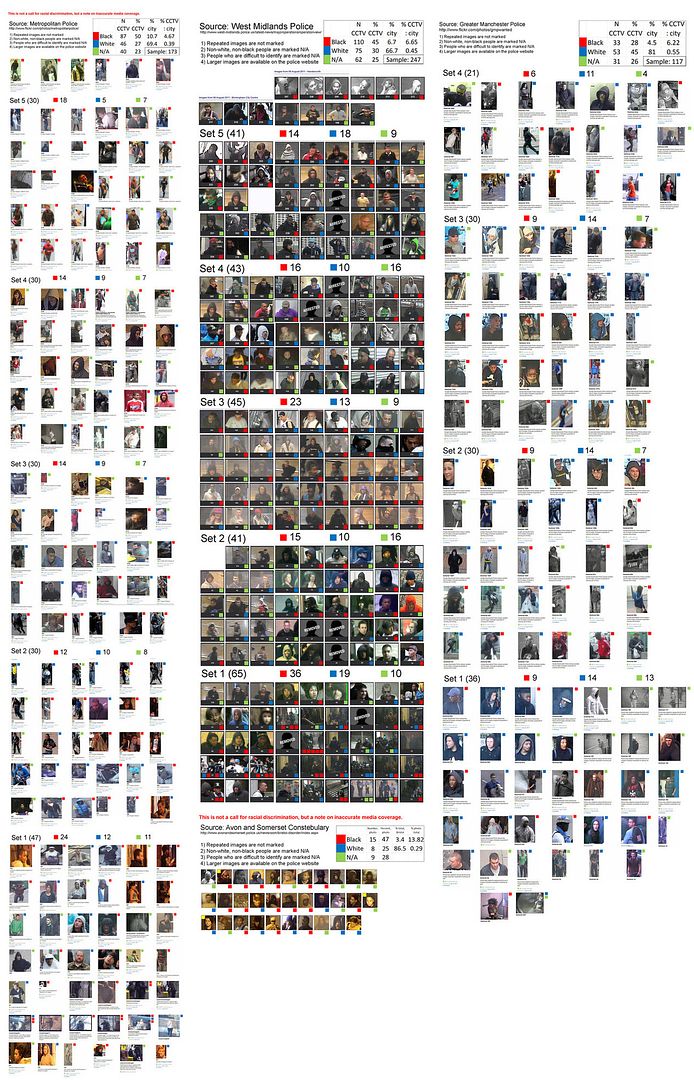
2. CCTV shows the majority of rioters are black
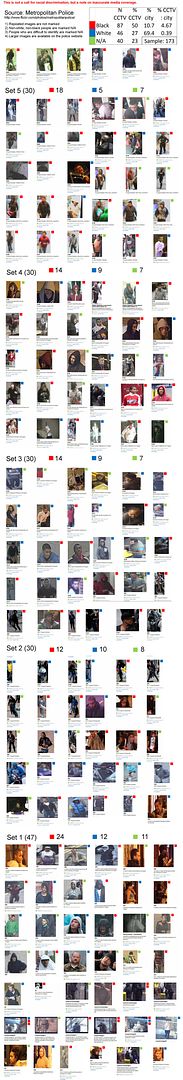
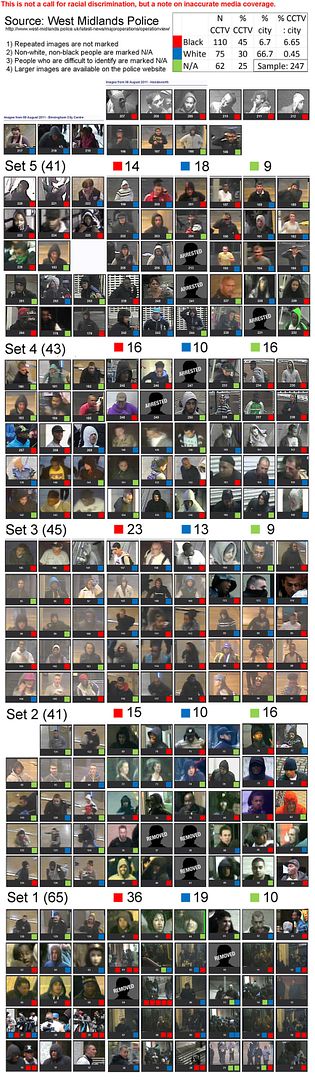
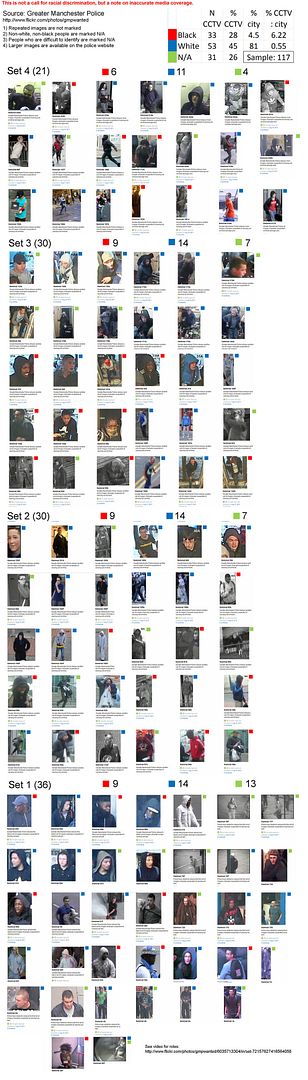
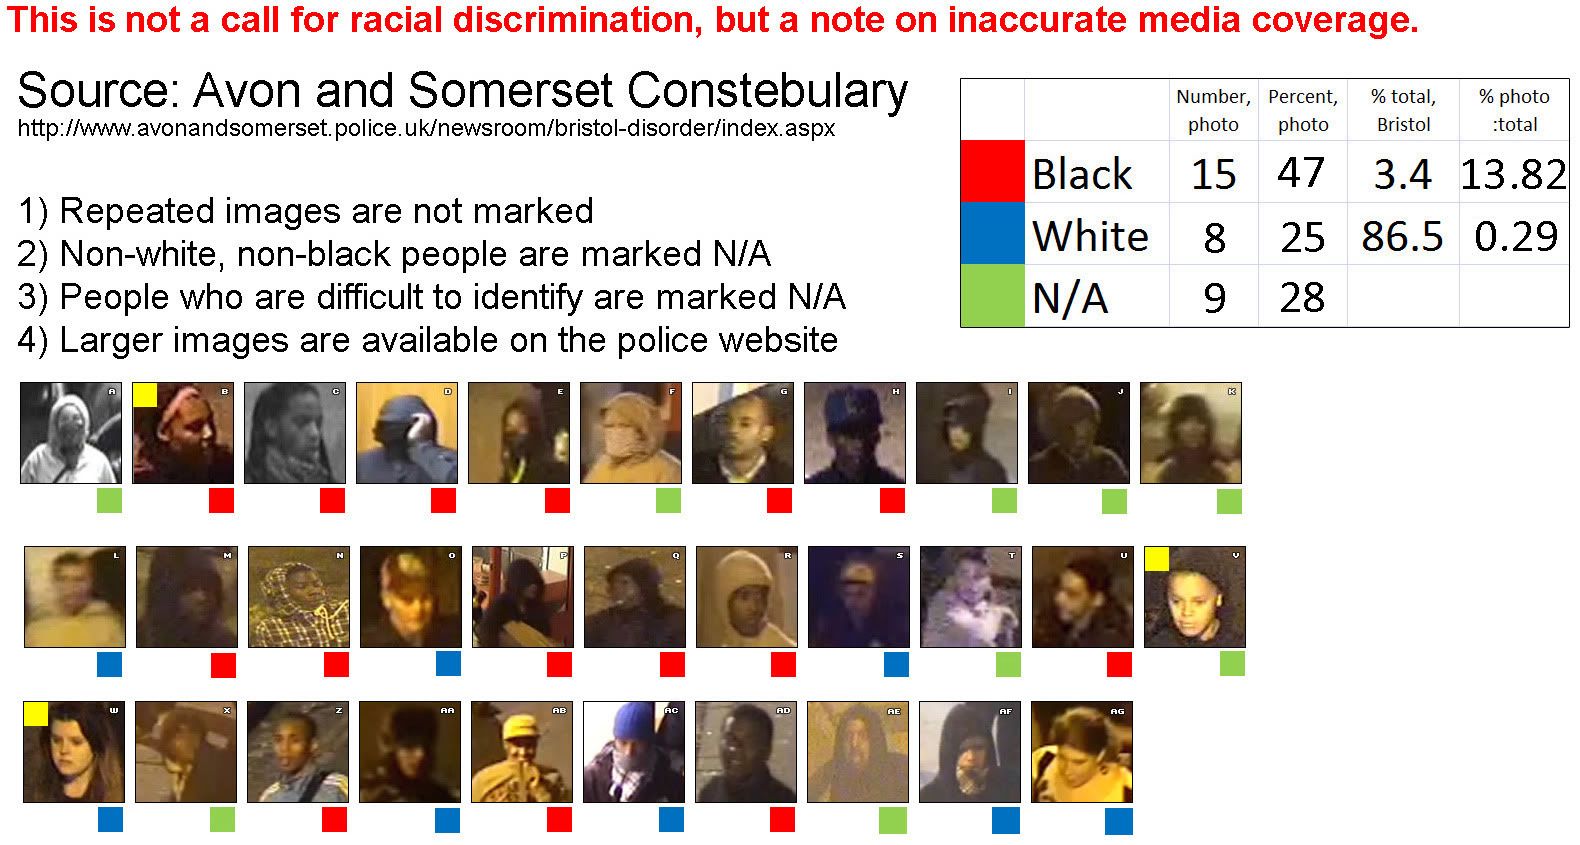
Police CCTV pictures of suspects in the 3 largest riots: London (1,051 arrested), Birmingham (218 arrested, 445 for West Midlands), Manchester (47 arrested, 174 for Greater Manchester). Bristol (24 arrested) is an example of a riot in a smaller settlement.
The size of the samples is adequate: 173 for London, 218 for Birmingham, 117 for Manchester, 32 for Bristol. The ratio of ethnicities remains similar in images published by the police after 13th August. Nottinghamshire (106 arrested) and Merseyside (77 arrested) CCTV images are not clear enough to be assessed, but seem to show a large black contingent as well.
It is impossible to predict the riots using the class and the skill maps, and even unemployment is highly imprecise. The ethnic map is the best predictor of riots.
2. CCTV shows the majority of rioters are black
Police CCTV pictures of suspects in the 3 largest riots: London (1,051 arrested), Birmingham (218 arrested, 445 for West Midlands), Manchester (47 arrested, 174 for Greater Manchester). Bristol (24 arrested) is an example of a riot in a smaller settlement.
The size of the samples is adequate: 173 for London, 218 for Birmingham, 117 for Manchester, 32 for Bristol. The ratio of ethnicities remains similar in images published by the police after 13th August. Nottinghamshire (106 arrested) and Merseyside (77 arrested) CCTV images are not clear enough to be assessed, but seem to show a large black contingent as well.
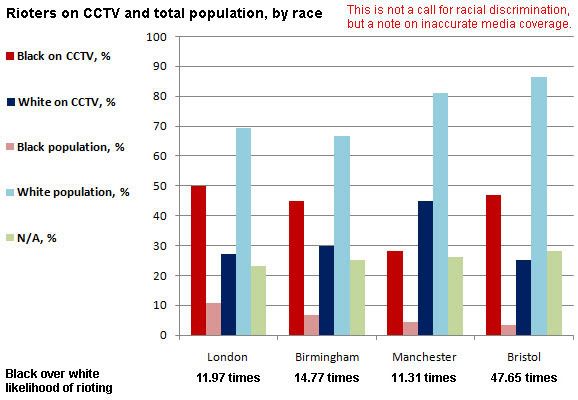
The ethnic map shows impressive predictive power, and it is possible to confirm this argument empirically. In London, Birmingham and Bristol whites form a minority of rioters: respectively 27%, 30%, and 25%. Only in Manchester do they constitute the majority - 45%. Manchester also has the largest percentage of non-white, non-black people participating. Black people are not only overrepresented, but simply outnumber everyone else by a large degree: 50%, 45%, and 47% - though only 28% in Manchester. Even if all white rioters were from the underclass, which is unlikely, 'chav' rioters would still be far fewer than black rioters. Indeed, it may be suggested that the 'chavs' joined the ongoing lootings, but did not instigate them, as in this video from Manchester: a black gang breaks into the shop, then mixed passers-by run in.

This table sums up the collections of all CCTV pictures available from police departments as of 20th August 2011.
CCTV images with race of the suspects marked:
London: http://i1128.photobucket.com/albums/m499/HumStats/UKRiots/CCTV_LondonMet.jpg
(full-sized police pictures: http://www.flickr.com/photos/metropolitanpolice/)
Birmingham: http://i1128.photobucket.com/albums/m499/HumStats/UKRiots/CCTV_Birmingham.jpg
(full-sized police pictures: http://www.west-midlands.police.uk/latest-news/majoroperations/operationview/#glry)
Manchester: http://i1128.photobucket.com/albums/m499/HumStats/UKRiots/CCTV_Manchester.jpg
(full-sized police pictures: http://www.flickr.com/photos/gmpwanted)
Bristol: http://i1128.photobucket.com/albums/m499/HumStats/UKRiots/CCTV_Bristol.jpg (AF and AC seem to be the same person)
(full-sized police pictures: http://www.avonandsomerset.police.uk/newsroom/bristol-disorder/index.aspx)
All on one image: http://i1128.photobucket.com/albums/m499/HumStats/UKRiots/All_Cities.jpg
London example (thumbnail):

3. UK and London areas with a small black population did not riot
An analysis of cities and London boroughs by black population and chance of rioting. A map of UK unemployment to illustrate the lack of correlation.
CCTV images with race of the suspects marked:
London: http://i1128.photobucket.com/albums/m499/HumStats/UKRiots/CCTV_LondonMet.jpg
(full-sized police pictures: http://www.flickr.com/photos/metropolitanpolice/)
Birmingham: http://i1128.photobucket.com/albums/m499/HumStats/UKRiots/CCTV_Birmingham.jpg
(full-sized police pictures: http://www.west-midlands.police.uk/latest-news/majoroperations/operationview/#glry)
Manchester: http://i1128.photobucket.com/albums/m499/HumStats/UKRiots/CCTV_Manchester.jpg
(full-sized police pictures: http://www.flickr.com/photos/gmpwanted)
Bristol: http://i1128.photobucket.com/albums/m499/HumStats/UKRiots/CCTV_Bristol.jpg (AF and AC seem to be the same person)
(full-sized police pictures: http://www.avonandsomerset.police.uk/newsroom/bristol-disorder/index.aspx)
All on one image: http://i1128.photobucket.com/albums/m499/HumStats/UKRiots/All_Cities.jpg
London example (thumbnail):
An analysis of cities and London boroughs by black population and chance of rioting. A map of UK unemployment to illustrate the lack of correlation.
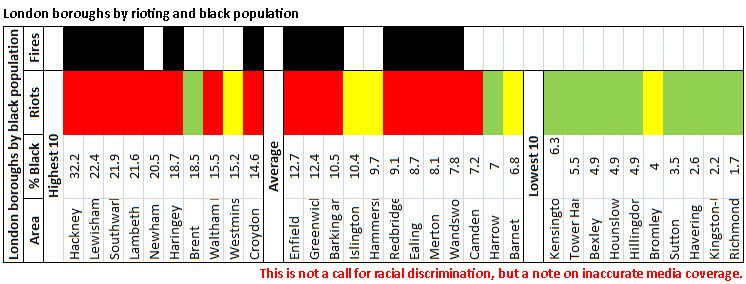
a. Non-black London boroughs did not riot. This graph demonstrates that the likelihood of rioting increases dramatically with the percentage of black population. Rioting in Brent was expected, but was prevented by the community and large police presence. Rioting in Bromley appears mild or non-existent, while in Woolwich (Greenwich) it was underreported in the media. Westminster reflects the incident at Oxford Circus, which involved a mob of 50.

b. Non-black settlements UK-wide did not riot. The riot threshold of black population is lower for large settlements than for boroughs, as it means they include smaller areas with large black population (e.g., London has Haringey). Consequently, Nottingham's 4.7% matters. One of the theories was that all large cities would experience riots because they follow similar patterns, but that is not the case. Large cities with a small black population did not riot.
c. Highly unemployed non-black settlements did not riot. (see the figure for B) Unemployment was shown to be the single best socioeconomic correlate of riots in London, better than education or class, but that was because it was an aspect of black communities. The UK has large areas with high unemployment that have a small black population. There were no disorders there.
Conclusion
Both theoretical and empirical evidence shows that it is improper to disconnect the August 2011 riots from race and ethnic culture. It is, likewise, inappropriate to associate it with the uneducated, low-skilled white lower class ('chavs'). It was severely underrepresented in the riots, and did not produce riots in numerous poor non-black areas. None of the socioeconomic factors have the same predicting power as black ethnicity in this case. In fact, they are largely meaningless to the riots when not a correlate of black population.
Why the black community played such a prominent role in the riots may be disputed. But it is clear that role of the black community was greater than that of any other group, and it should be accordingly regarded in the media.
Sources
Maps
Maps of ethnicity, education, class and other factors in London: http://www.londonprofiler.org/
Suspected addresses map: http://www.telegraph.co.uk/news/ukne...urt-cases.html
Riots map: http://www.guardian.co.uk/news/datab...-listed-mapped
UK map of unemployment by date: http://www.bbc.co.uk/news/10604117
Police CCTV images (updated 13th August)
Metropolitan Police suspects: http://www.flickr.com/photos/metropolitanpolice/
West Midlands Police suspects: http://www.west-midlands.police.uk/l...operationview/
Greater Manchester Police suspects: http://www.flickr.com/photos/gmpwanted
Avon & Somerset Constebulary suspects: http://www.avonandsomerset.police.uk...der/index.aspx
Data on ethnicity
London ethnic groups by borough: http://legacy.london.gov.uk/gla/publ...-estimates.pdf
Other cities: http://neighbourhood.statistics.gov....do?pageId=1001